Velo'V
BI over bike-share service
Project
Features
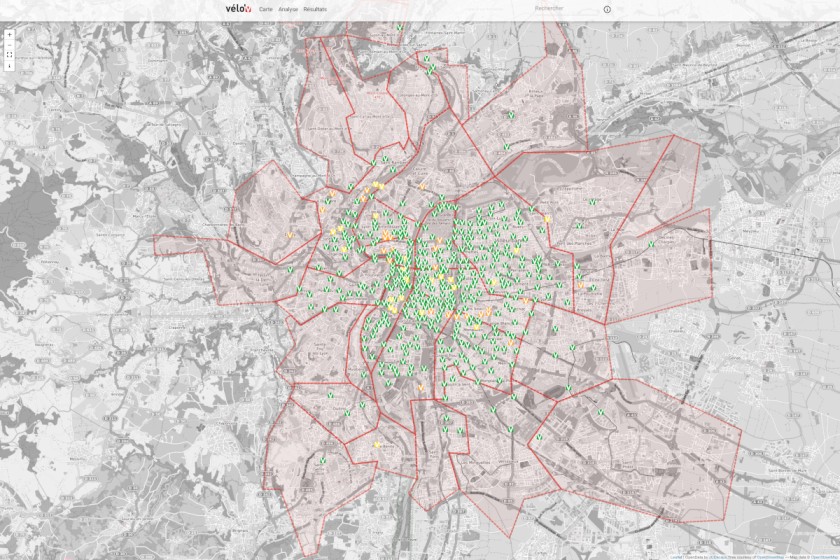
Real-time station status
Real-time station status
See in real-time how many bikes and places are available, as well as station failures
Real-time district statistics
Real-time district statistics
Check how the district's stations are compared to other districts, with number of stations and bikes per habitant
Past analysis
Past analysis
See how the network behaves during a month-long analysis with 5-min frequency, compared to availability, weather...